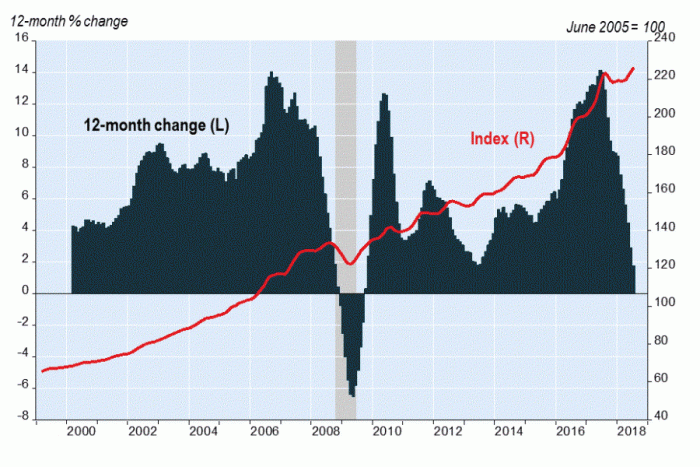
In August the Teranet–National Bank National Composite House Price IndexTM was up 0.2% from the previous month.[1] Removing normal seasonal patterns (seasonal adjustment), the index would have been virtually flat, following retreats in June and July. In other words, after seasonal adjustment, the downtrend of June and July did not turn around in August.
Individual market indexes were up in eight of the 11 metropolitan markets surveyed. Seasonally adjusted, they would have been up in only four. The published (non-seasonally-adjusted) indexes were up strongly under any respect in Ottawa-Gatineau (1.4%), Hamilton (1.4%), Montreal (1.2%) and Quebec City (0.5%). However, gains in Toronto (0.3%), Edmonton (0.2%), Victoria (0.1%) and Winnipeg (0.1%) only reflected usual seasonal pressures. After seasonal adjustment, these indexes would have dropped or be flat. Indexes were down for Halifax (−0.6%), Calgary (−0.3%) and Vancouver (−0.4%).
The published Toronto index was up for a fifth straight month. But it is the opposite after seasonal adjustment as the index would then have been down for a fifth straight month. For Vancouver and Victoria it was a third straight month of decline after seasonal adjustment.

In August the composite index was up 1.4% from a year earlier, the smallest 12-month rise since November 2009. This weakness is partly attributable to a peak in August 2017 from which the index declined in following months. For this reason the 12-month rise is likely to accelerate in the months ahead. August 2018 indexes were down from a year earlier in Toronto (−3.3%), Hamilton (−0.7%), Calgary (−0.5%) and Edmonton (−0.3%). They were up from a year earlier in Winnipeg (1.3%), Quebec City (1.4%), Halifax (4.6%), Montreal (4.8%), Victoria (5.0%), Ottawa-Gatineau (5.2%) and Vancouver (7.6%).
Besides the Toronto and Hamilton indexes included in the composite index, indexes exist for the seven other urban areas of the Golden Horseshoe. In July, two of these, Barrie and Oshawa, were, like Toronto and Hamilton, below their peaks of Q3 2017. Indexes not included in the composite index also exist for seven markets outside the Golden Horseshoe, five of them in Ontario and two in B.C. The 12-month rise of these indexes varied widely, from 1.5% for Sudbury to 14.3% for Abbotsford-Mission.
For the full report including historical data, please visit: www.housepriceindex.ca


